Paul Thompson's Research Publications
Growth Mapping Paper - Final Version
Dear Co-authors --
Here are the final drafts for you of the Nature paper, responses to reviewers,
and the figures.
First Revision of Paper (.pdf)
Responses to Reviewers (.pdf)
Final Paper accepted for Publication (.pdf)
The only difference is that I've re-lettered the figures since these (where it says Fig. 5(a)-(d)
here it is actually Fig. 6(c)-(f)), and these are lower-res.
versions.
I hope they download quickly! There are higher-res. versions of the figures that you are more than welcome
to have for your talks or chapters - they are 6 gzipped TIFF files (.tiff.gz), in:
http://www.loni.ucla.edu/~thompson/JAY/GIFS/
Please let me know when you have these, I'll take it all off the Web while it's in press.
Cheers! -- Paul
Figure 1: Here growth rates are mapped for the corpus callosum, the major fiber tract that communicates
information between the two brain hemispheres. The maps are made based on scanning the same child at age
3 and 6, another child at age 6 and 7, etc. There are two major surprises. The first is the extremely high
growth rates (up to 80% gain of tissue locally) in specific brain regions. Fastest growth (red
colors) is found consistently, across ages 6-13, in the isthmus, a region of the corpus callosum that carries fibers to
areas of the cerebral cortex that support language function, and areas of the temporo-parietal cortex that support mathematical thinking.
Growth rates in the fibers projecting to language cortex are dramatically reduced after puberty (11-15 years).
Note how different the peak growth rates are in a child between the ages of 3 and 6, where 80% growth is
revealed in frontal regions that support the planning of new actions and the organization of new behaviors.
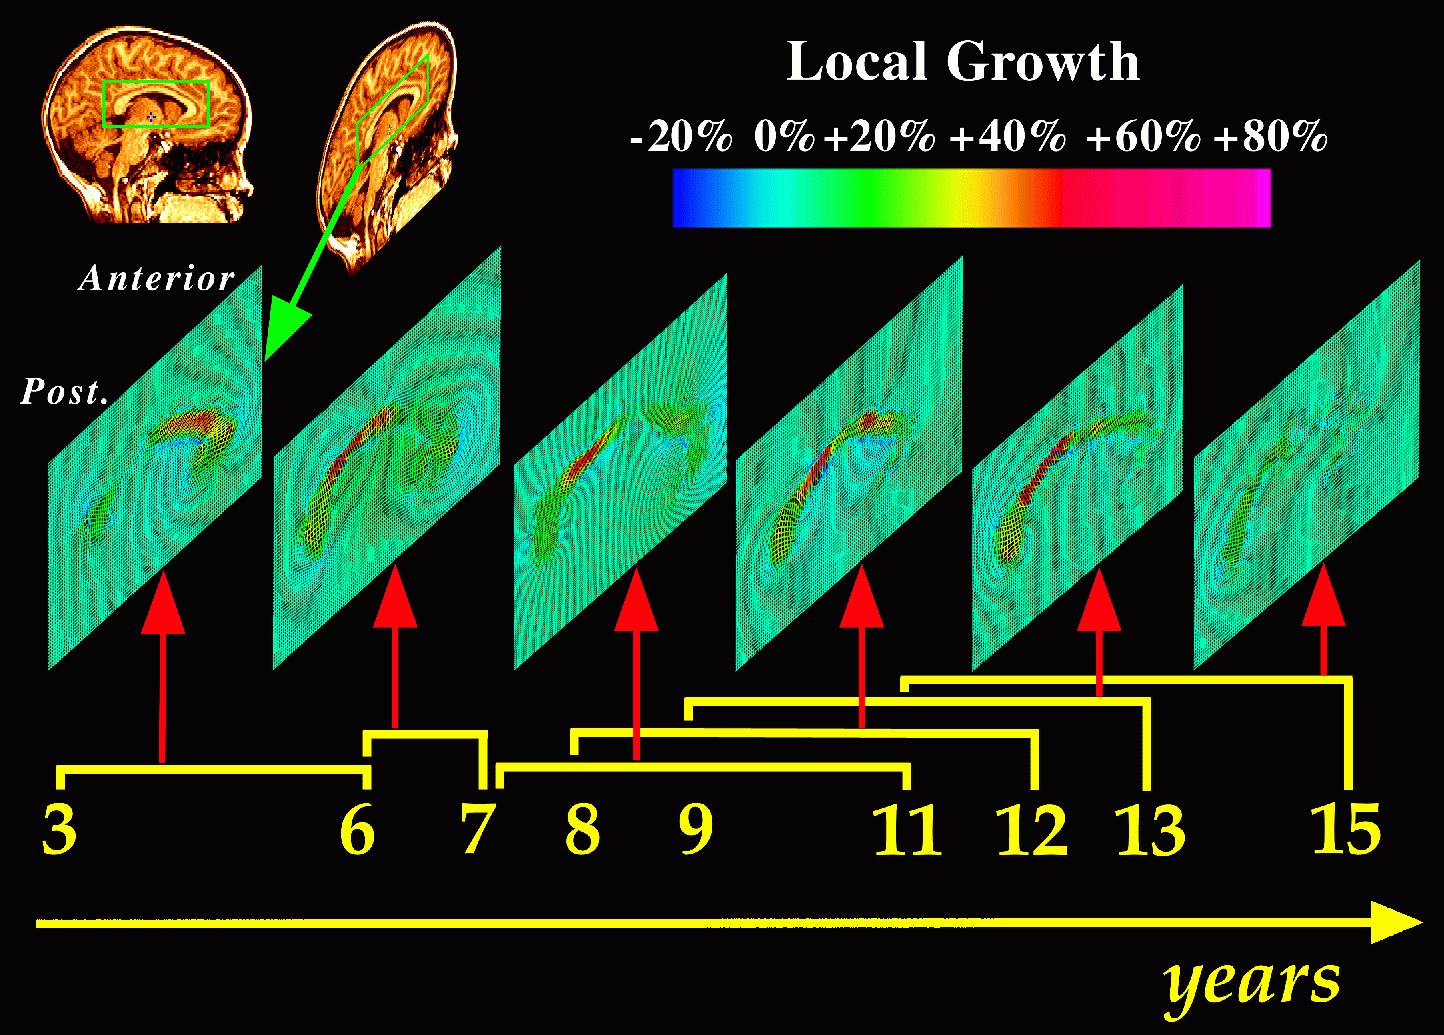
Figure 2: Here the details of growth rates are revealed for a range of individual children. Tensor maps
allow growth rates to be mapped in an individual child. They uncover regions in which growth rates are
fastest, and visualize changes in these patterns across time. Again, red colors indicate fastest growth in fiber regions
that innervate temporo-parietal cortex, a brain region which is functionally specialized to support language function.
Note how drastically reduced growth is in the 11-15 year age range, which also marks the end of a critical period when children
are most efficient at learning new languages.
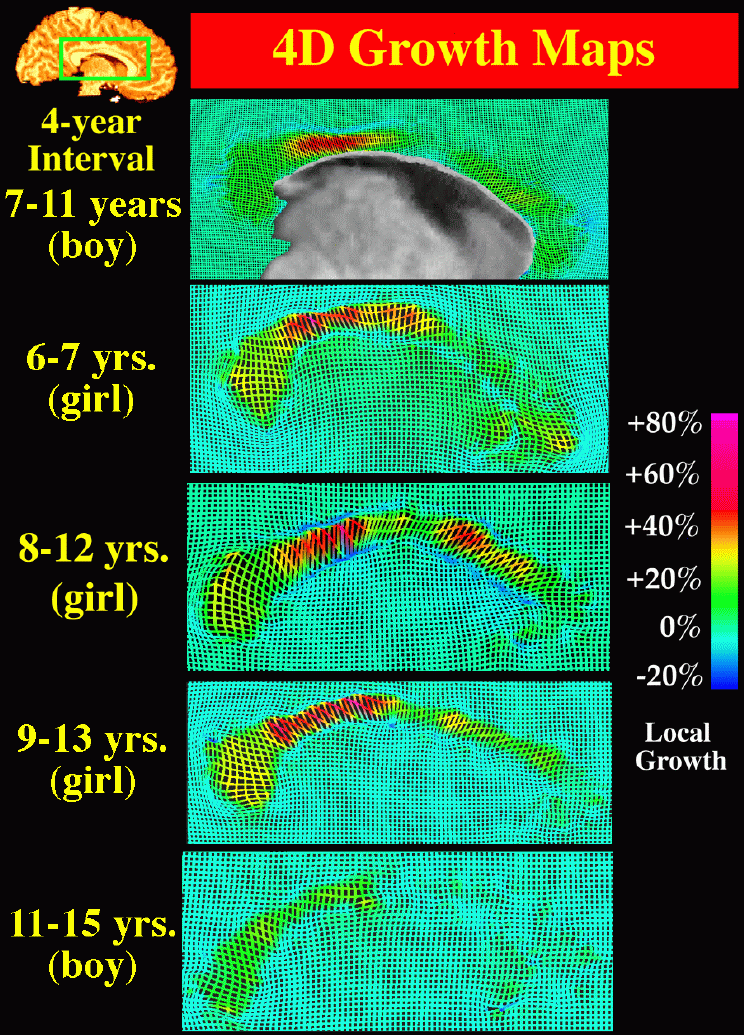
Figure 3: To validate the approach, it is necessary to show that changes are not recovered at very short time intervals.
This example shows that the biological changes across four years are far greater in magnitude than the day-to-day changes
in the anatomy of the brain.
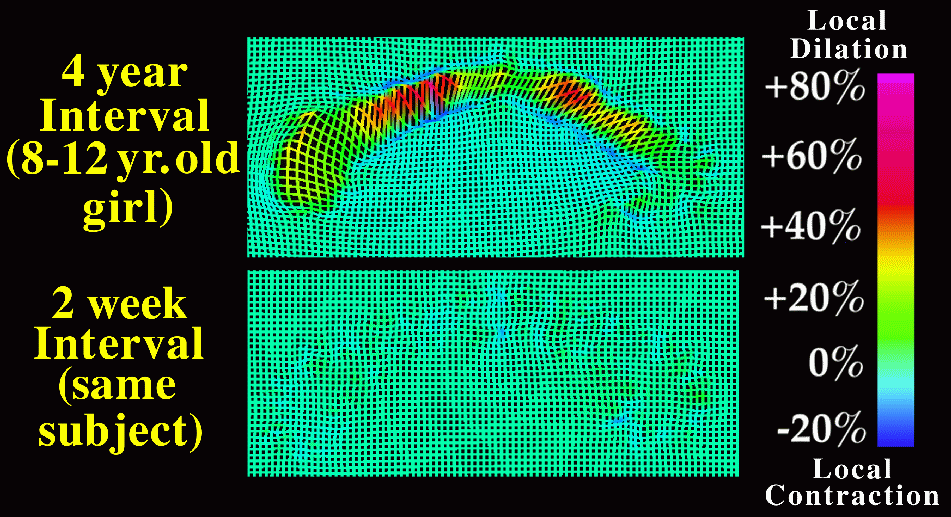
Figure 4: In a much younger child, different circuits are growing fastest. Here the growth rates are most rapid in
fibers that send information to frontal cortex. These fibers mediate the planning and organization of new behaviors and actions.
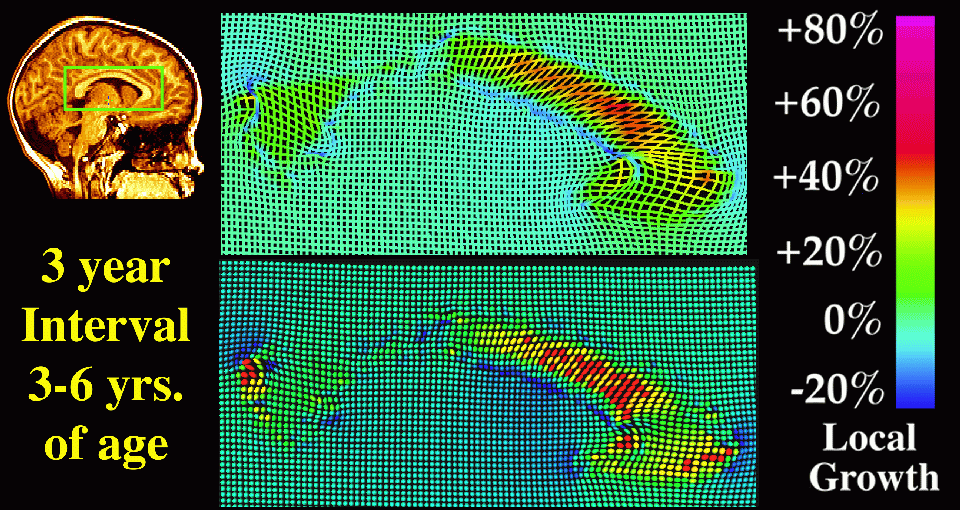
Figure 5: Growth at the regions of the corpus callosum that innervate language cortex (above) is accompanied
by marked growth in the language cortex itself (red colors). The magnitude of the effect, which is small but detectable,
is shown by overlaying brain models from the same child scanned at different ages (here at ages 9 and 13).
(panel d).
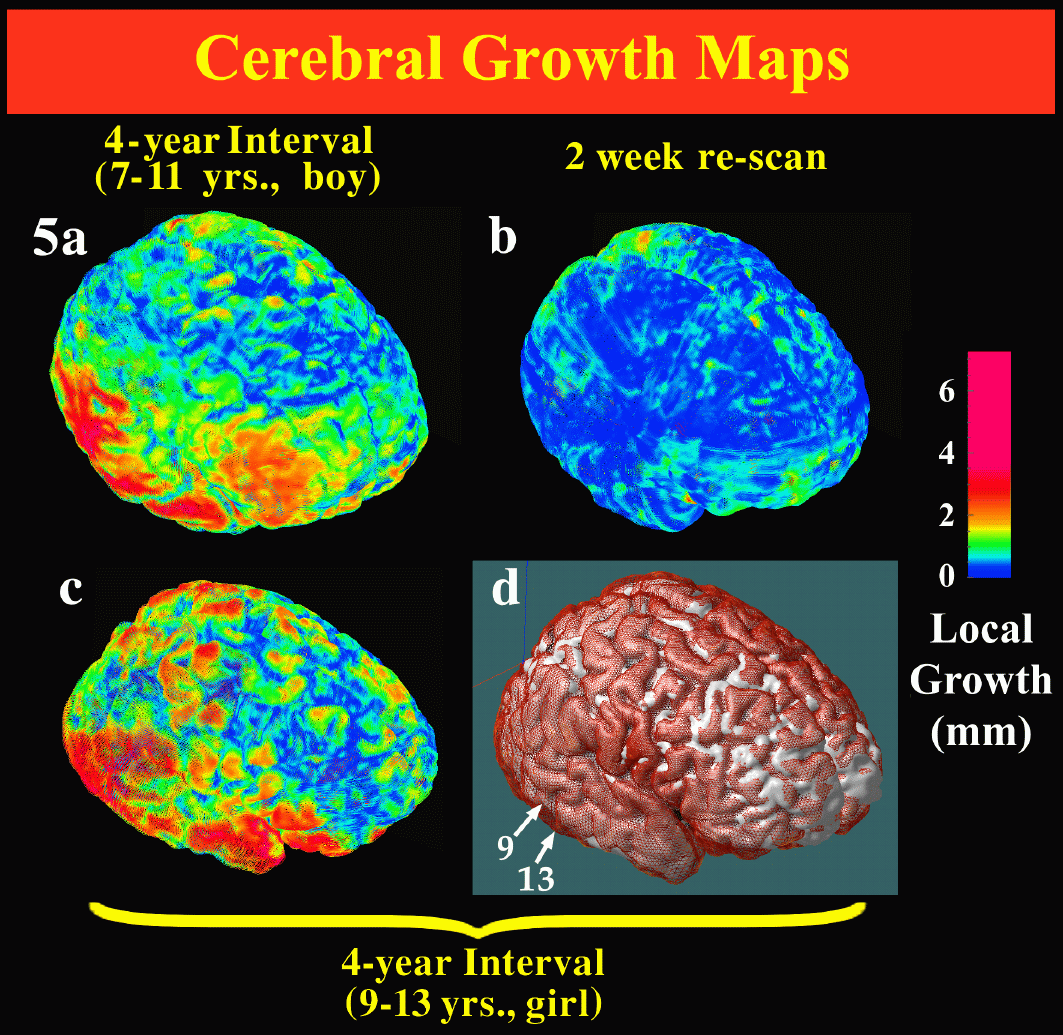
Figure 6: All these growth maps are made by building models of brain structures at each time-point (here the ventricular system
is modeled, a structure which consists of fluid-filled compartments in the center of the brain). The deformation required to match models with their later
counterparts is then computed (below). This is then mathematically separated into global shifts of tissue and purely local
changes. It is important to separate these, as this allows local growth rates to be mapped.
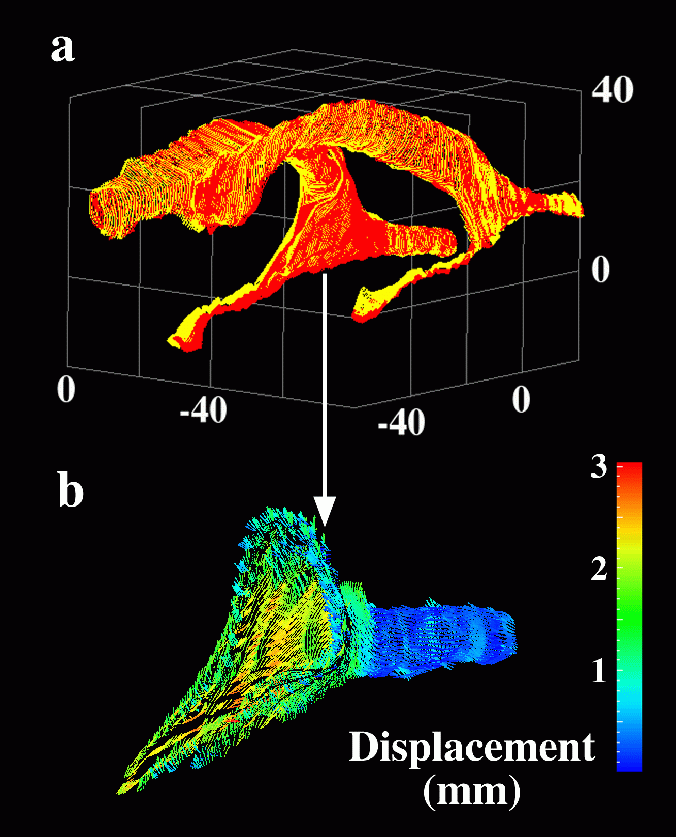
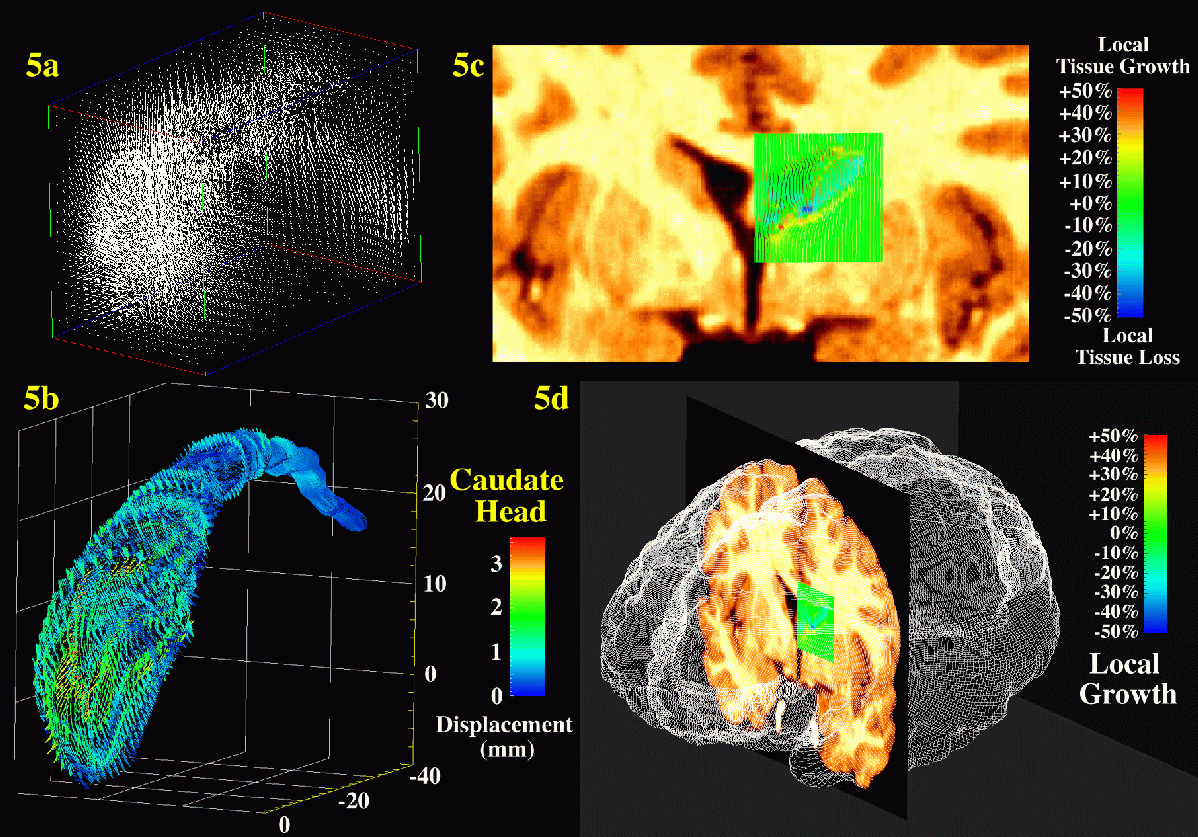
Figure 6 (lettering now changed to read 6(c)-6(f), in final manuscript): Brain tissue is also lost during development.
Here there is a rapid loss of tissue in the caudate nucleus of a 7-11 year old child, a structure that supports learned motor
behavior, such as learning to ride a bike. Loss of tissue may suggest localized increases in processing efficiency,
and elimination of redundant brain tissue as development progresses. Note the complexity of these growth patterns,
as rapid growth is also occurring close to the site where tissue is lost.
Related Publications
Disease-Specific Brain Atlases
other research areas
(back to main list)
Contact Information
Mail:
Paul Thompson, Ph.D.
Assistant Professor of Neurology
UCLA Lab of Neuro-Imaging and Brain Mapping Division
Dept. Neurology and Brain Research Institute
4238 Reed Neurology, UCLA Medical Center
710 Westwood Plaza
Westwood, Los Angeles CA 90095-1769, USA.
E-mail:
thompson@loni.ucla.edu
Tel: (310)206-2101
Fax: (310)206-5518
